Overview report
Last updated View as Markdown (opens in a new tab)
See call totals by day, by hour and by day of the week to find your busiest times.
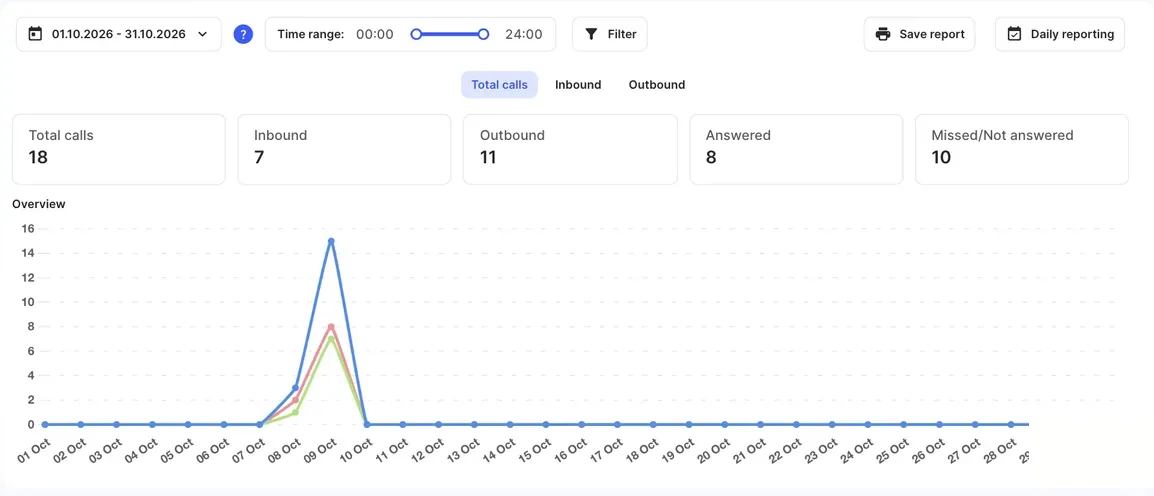
The Overview report sums up your calls for a period: how many came in and went out, how many were answered or missed, and when. Use it to plan staffing around your busiest days and hours. To see individual calls, use Call history.
Run the report
Section titled “Run the report”- Go to Reports › Overview.
- Choose the dates in the date range picker. To include only certain hours, drag the Time range: slider.
- Click Filter to narrow the report if needed, then click Apply. You can filter by Subaccount, Call type, Call status, Phonebook contact, Phone number, Caller ID, Dialed number and Terminate cause. Reset clears the filters.
- Choose Total calls, Inbound or Outbound.
You can choose dates within the last six months.
What it shows
Section titled “What it shows”| Item | What it shows |
|---|---|
| Total calls | All calls in the period. |
| Inbound | Calls received. |
| Outbound | Calls made. |
| Answered | Calls that were answered. |
| Missed/Not answered | Inbound calls nobody answered, and outbound calls the other party didn’t answer. |
| Overview chart | Calls for each day of the period. |
| During the day chart | Calls for each hour of the day. Shows your peak hours. |
| By day of the week chart | Calls for each weekday. Shows your busiest days. |
Save or schedule it
Section titled “Save or schedule it”- Click Save report to download the report, with your filters applied, as a PDF.
- Click Daily reporting to email reports to chosen administrators every day. See Reports overview.
- Switch to Inbound to see when customers call you, and to Outbound to see when your team makes calls.
- For a longer view, use Monthly call volume, which covers the last six months.